Making charts and graphs in Excel is not a real pleasure; Google sheets works much better esp if you to publish the graphs and charts on line. Here is an example using Worldbank data. However for data analysis R is my first choice. Now I can integrate R with Google charts, using googleVis in R. Here is the handout.
R-Bloggers published the following example for Worldbank data.
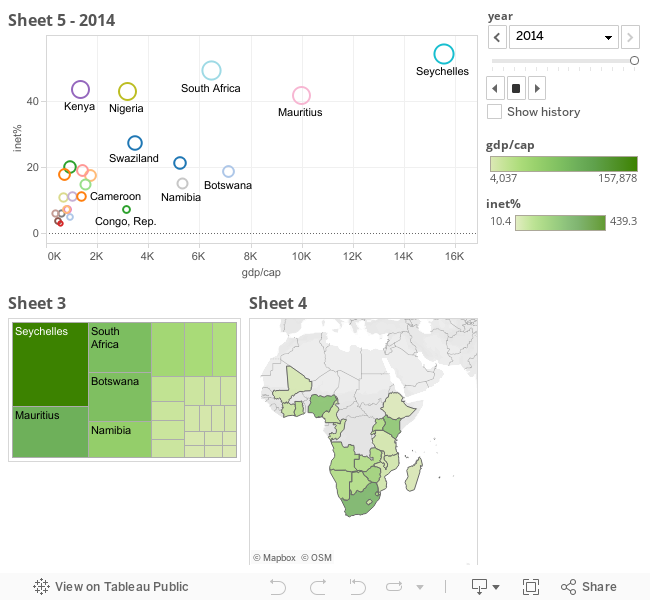
Making moving charts is now so easy. Here is my example based on Worldbank data; showing relationship between GDP per cap and Internet access per 100 from 2001 to 2014 for sub sahara african countries.
Data look as follows:
gi<-read.xls("gi.xls") str(gi) 'data.frame': 154 obs. of 4 variables: $ country : Factor w/ 11 levels "Botswana","Ghana",..: 1 1 1 1 1 1 1 1 1 1 ... $ year : int 2001 2002 2003 2004 2005 2006 2007 2008 2009 2010 ... $ gdppercap: num 3115 3044 4149 4879 5328 ... $ inetperc : num 3.43 3.39 3.35 3.3 3.26 ... summary(gi) country year gdppercap inetperc Botswana:14 Min. :2001 Min. : 149.4 Min. : 0.0899 Ghana :14 1st Qu.:2004 1st Qu.: 446.7 1st Qu.: 2.2950 Kenya :14 Median :2008 Median : 930.5 Median : 5.4925 Malawi :14 Mean :2008 Mean :1962.4 Mean : 8.8989 Namibia :14 3rd Qu.:2011 3rd Qu.:2919.8 3rd Qu.:11.5000 Nigeria :14 Max. :2014 Max. :8081.4 Max. :49.0000 (Other) :70 >Motion=gvisMotionChart(gi, + idvar="country", + timevar="year") >plot(Motion) | |
Geen opmerkingen:
Een reactie posten
Opmerking: Alleen leden van deze blog kunnen een reactie posten.