zondag 20 december 2015

Data journalism made easy

Data services on the web lower the threshold to data journalism. No tinkering with statistics in Excel or maps in Google FT. Just upload your data push a button and there are the graphs and maps, either as an embed link, pdf of jpg.
I looked into one of those services: datawrapper . The prices are quite reasonable; for 12 Euro a month you are in business. However datawrapper is also open source. you can clone it from Github and install it.


woensdag 28 oktober 2015

woensdag 14 oktober 2015

What's the deal with data journalism? (Guest Story)

Data journalism is not a new concept. It is however, still a daunting one for many. Operating high-tech systems, coding, and number crunching aren’t skills you’d find on a traditional journalist’s CV. But according to experts, if journalists want to stay relevant they should be looking seriously toward the digital world of data.
By Remy Raitt

“To find a job as a journalist is extremely difficult; lots of journalists have been laid off and are unemployed,” says former Utrecht University journalism, politics and new media lecturer and owner of D3-Media, Peter Verweij. “A strong position in the market comes with multi-media skills and/or data skills; being a fine writer is not enough.”

Published: http://www.mediaupdate.co.za/media/82921/whats-the-deal-with-data-journalism


dinsdag 15 september 2015

vrijdag 31 juli 2015

Windows10

I am not a fan of Windows, updated to Windows10 yesterday. It is not Linux, but Windows10 works smoothly and you can find your programs with the start button.

woensdag 27 mei 2015

Are Coders Taking Over

(This article is an edited version of the speech given at the Josh Friedman price ceremony at GIPA, Tbilisi, Georgia, June 9 2015; published at Memeburn  http://memeburn.com/2015/06/has-coding-become-journalisms-most-important-skill/)

Journalism will never be as before. The rise of internet not only changed the business model for media but also the content. Data is the new content. Of course journalism is still about storytelling, but it is changing fast in another direction. Drones- drone journalism- are now almost an accepted tool for reporting. Computers could be instructed to write basic stories: robot journalism. Take for example a story from NY Times Upshot about the best and worst places to grow up in the US and notice how the text changes according to the data selected. 

The latest development is sensor journalism. Buy an Arduino board and a few sensors, write a program for the processor and you are in business. An interesting example is the air quality in San Diego, where students of the University measured the air pollution in different parts of the city. Access to water points in Tanzania or water pollution in streams and dams used as potable water in South Africa are other interesting try outs.  It is undeniable that the influence of technology on journalism especially IT and coding is growing. Where is data journalism going?

maandag 4 mei 2015

Wordt datajournalistiek een soort van ‘invuljournalistiek’?


Het lijkt tegenwoordig steeds makkelijker te worden om aan datajournalistiek. Je gooit wat cijfers in een webdienst als Datawrapper of LocalFocus en rolt vanzelf een mooie visualisatie uit. Betekent dit dat datajournalistiek een simpele invuloefening wordt voor elke journalist?
Alhoewel datajournalistiek al meer dan 50 jaar oud is begint zij nu pas aan een grote vlucht. Met regelmaat publiceren de media resultaten van analyse van cijfers, meestal voorzien van schitterende visualisaties. De lintjesregen, de beste gemeente van Nederland, sterftecijfers van ziekenhuizen, inbraken, verkeersongelukken, verkiezingsuitslagen en natuurlijk vluchtelingen/asielzoekers, alles wordt gekwantificeerd en de conclusies zijn nieuws.
Gepubliceerd op De Nieuwe Reporter

maandag 6 april 2015

MAKING MAPS WITH R

Last week I was delivering a training to journalists of the 'Persgroep'. Topic: datajournalism2: more advanced techniques for data journalists. A short introduction to R was on the list. Using data about Dutch municipalities - gemeentedata- we did basic statistics in R. Faster and easier then in Excel.
You don't  have a clue about R? Take a training; for example this one: http://tryr.codeschool.com/. Install R studio on your machine. How? Read everything about installing R and R studio at http://www.r-bloggers.com/.
My students were enthusiastic while calculating percentages, mean, 2x2 tables etc. And the graphs...quick and easy.
So R is the replacement for Excel. But how about mapping? I played around with R and found some nice easter eggs. There are many examples about how to get your code ready to map your data. Try for example: https://rpubs.com/nickbearman/r-google-map-making and this one: http://prabhasp.com/wp/how-to-make-choropleths-in-r/
Here is some data used from an exercise with Refine; simply putting some markers on a Google map.
A bit more complicated are polygon maps. Here is one about high incomes in Dutch municipalities.
Could R become my Swiss army knife for data journalism?


woensdag 11 maart 2015

Mapping Twitter Followers in R

R is an interesting project for data journalism.Why? Here is an answer.
Was playing around with in R with the Twitter API and package twitteR. Here is een example of mapping followers and following on Twitter.
The how-to is here: http://thinktostart.com/map-twitter-followers-with-r/


zaterdag 7 maart 2015

WD My Book Live

Is my media server hacked? the green LED on the front was constantly on or blinking, indicating that there is read/write activity. However the led continued blinking even when there was no connection of my machines. From outside perhaps? Hardly possible with a firewall.
Some research unveiled that there is a media crawler active on the media server, indexing and reformatting pictures. I wanted to turn the crawler of because the server got hot and was working continuously. Here is how to.

maandag 2 maart 2015

Snow's cholera map revisited

The cholera map of John Snow from 1854  solved the mystery of cholera by relating it to contaminated wells and pumps. It is also a classical example of GIS analysis. It has also become  a paradigm for data journalism.


Now Snow's data are re-analyzed and mapped using R and Open Street maps. Here are two interesting maps.


zondag 1 maart 2015

New Tablet: Samsung SM T800


Can you control your phone and laptop from an android tablet? With the Samsung SM T800  you can. Just bought one with a keyboard cover. It is fast, nice screen, multi tasking and tons of apps. With Hancom Office you can use Powerpoint, Excel or Word. When all your documents are in the cloud, you only have to take this tablet to be in business everywhere.

vrijdag 13 februari 2015

Google Analytics in R


Playing around with R using data van Google Analytics, using the following recipes:

Here are some graphs:

Daily visits for 2014

ggplot(myresults, aes(x=date, y=visits))+ geom_point() +
+    stat_smooth()
 

woensdag 11 februari 2015

Social Networks with Facebook and LinkedIN

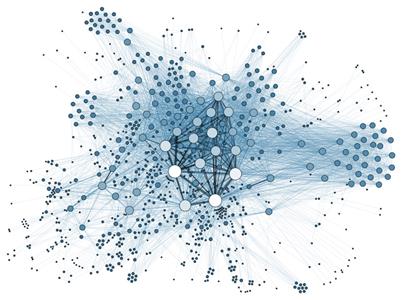
NodeXL, an add on to Excel,is a very nice tool to analyze social networks. It has a standard import utility for Twitter, Flickr and YouTube data. What to do with Facebook and LinkedIN networks? Facebook is easy: just download the social network importer and you have under import tab in NodeXL an option for dowloading Facebook data. Here is the install.


zondag 4 januari 2015

10 LESSONS FROM DATA JOURNALISM TRAINING

In the nineties of the past century it was called Computer Assisted Research and Reporting; now it is called Data Journalism. Since I early retired from the School of Journalism about three years ago, I decided to focus on training working journalists in data journalism. The Netherlands is a bit small for these activities and most of my work is in Europe, the borders of Europe and Sub-Sahara Africa. Training takes a couple of days from a 3 days minimum to 5 days maximum. Looking back over the past year I come to the following conclusions. Published at Paul Bradshaw Online Journalism Blog

zaterdag 3 januari 2015

10 LESSEN VAN DE TRAINING DATAJOURNALISTIEK


Toen ik begon heette het nog Computer Assisted Research and Reporting (CARR), dat was in de jaren negentig van de vorige eeuw. Nu heet het datajournalistiek. Sinds ik gestopt ben met lesgeven op de School voor Journalistiek, zo'n drie jaar geleden, richt ik mij full time op het trainen van journalisten in datajournalistiek. Nederland is wat klein en veel van mijn aktiviteiten vinden plaats in Europa( de Persgroep, De Telegraaf en Wegener), de randen van Europa(Georgië, Bosnië en Herzegowina) of zuidelijk en oost Afrika. Trainingen duren over het algemeen enkele dagen, minimaal 3 en maximaal 5. Als ik terugkijk op het afgelopen jaar kan ik de volgende conclusies trekken. 
Ook op De Nieuwe Reporter